Precision, Recall and F-measure

In the last post we discussed accuracy, a straightforward method of calculating the performance of a classification system. Using accuracy is fine when the classes are of equal size, but this is often not the case in real world tasks. In such cases the very large number of true negatives outweighs the number of true positives in the evaluation so that accuracy will always be artificially high.

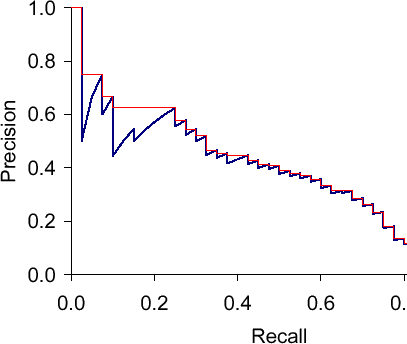
Luckily there are performance measures that ignore the number of true negatives. Two frequently used measures are precision and recall. Precision P indicates how many of the items that we have identified as positives are really positives. In other words, how precise have we been in our identification. How many of those that we think are X, really are X. Formally, this means that we divide the number of true positives by the number of all identified positives (true and false):
P = TP/(TP+FP)

Recall R indicates how many of the real positives we have found. So from all of the positive items that are there, how many did we manage to identify. In other words, how exhaustive we were. Formally, this means that we divide the number of true positives by the number of all existing positives (true positives and false negatives):
R = TP/(TP+FN)

For our example from the last post, precision and recall are as follows:
P = 1/(1+3) = 1/4 = 0.25
R = 1/(1+2) = 1/3 = 0.33

It is easy to get a recall of 100%. We just say for everything that it is a positive. But as this will probably not the case (or else we have a really easy dataset to classify!), this approach will give us a really low precision. On the other hand, we can usually get a high precision if we only classify as positive one single item that we are really, really sure about. But if we do that, recall will be low, as there will be more than one item in the dataset to be classified (or else it is not a very meaningful set).

So recall and precision are in a sort of balance. The F1 score or F1 measure is a way of putting the two of them together to produce one single number. Formally it calculates the harmonic mean of the two numbers and weights the two of them with the same importance (there are other variants that put more importance on one of them):
F_1 = (2 \cdot P \cdot R)/(P + R)

Using the values for precision and recall for our example, F1 is:
F_1 = (2 \cdot 0.25 \cdot 0.33)/(0.25 + 0.33) = 0.165 / 0.58 = 0.28

Intuitively, F1 is between the two values of precision and recall, but closer to the lower of the two. In other words, it penalizes if we concentrate only on one of the values and rewards systems where precision and recall are closer together.

Link for a second explanation: Explanation from an Information Retrieval perspective

Accuracy

We are still trying to figure out how good our system for determining whether e-mails are spam or not is. In the last post we ended up with a confusion matrix like this:

Actual label
Spam NonSpam
Predicted label Spam 1 (true positives, TP) 3 (false positives, FP)
NonSpam 2 (false negatives, FN) 4 (true negatives, TN)

Now we want to calculate numbers from this table to describe the performance of our system. One easy way of doing this is to use accuracy A. Accuracy basically describes which percentage of decisions we got right. So we would take the diagonal entries in the matrix (the true positives and true negatives) and divide by the total number of entries. Formally:
A = (TP+TN)/(TP+TN+FP+FN)

In our example the accuracy is:
A = (1+4)/(1+4+2+3) = 5/10 = 0.5

Using accuracy is fine in examples like the above when both classes occur more or less with the same frequency. But frequently the number of true negatives is larger than the number of true positives by many orders of magnitudes. So let’s assume 994 for true negatives and when we calculate accuracy again, we get this:
A = (1+994)/(1+994+2+3) = 995/1000 = 0.995

It doesn’t really matter if we correctly identify any spam mails. Even if we always say NonSpam, so we get zero Spam-Mails right, we still get more nearly the same accuracy as above. So accuracy is not a good indicator of performance for our system in this situation. In the next post we will look at other measures we can use instead.

Link for a second explanation: Explanation from an Information Retrieval perspective

Confusion matrix

Let’s say we want to analyze e-mails to determine whether they are spam or not. We have a set of mails and for each of them we have a label that says either "Spam" or "NotSpam" (for example we could get these labels from users who mark mails as spam). On this set of documents (the training data) we can train a machine learning system which given an e-mail can predict the label. So now we want to know how the system that we have trained is performing, whether it really recognizes spam or not.

So how can we find out? We take another set of mails that have been marked as "Spam" or "NotSpam" (the test data), apply our machine learning system and get predicted labels for these documents. So we end up with a list like this:

Actual label Predicted label
Mail 1 Spam NonSpam
Mail 2 NonSpam NonSpam
Mail 3 NonSpam NonSpam
Mail 4 Spam Spam
Mail 5 NonSpam NonSpam
Mail 6 NonSpam NonSpam
Mail 7 Spam NonSpam
Mail 8 NonSpam Spam
Mail 9 NonSpam Spam
Mail 10 NonSpam Spam

We can now compare the predicted labels from our system to the actual labels to find out how many of them we got right. When we have two classes, there are four possible outcomes for the comparison of a predicted label and an actual label. We could have predicted "Spam" and the actual label is also "Spam". Or we predicted "NonSpam" and the label is actually "NonSpam". In both of these cases we were right, so these are the true predictions. But, we could also have predicted "Spam" when the actual label is "NonSpam". Or "NonSpam" when we should have predicted "Spam". So these are the false predictions, the cases where we have been wrong. Let’s assume that we are interested in how well we can predict "Spam". Every mail for which we have predicted the class "Spam" is a positive prediction, a prediction for the class we are interested in. Every mail where we have predicted "NonSpam" is a negative prediction, a prediction of not the class we are interested in. So we can summarize the possible outcomes and their names in this table:

Actual label
Spam NonSpam
Predicted label Spam true positives (TP) false positives (FP)
NonSpam false negatives (FN) true negatives (TN)

The true positives are the mails where we have predicted "Spam", the class we are interested in, so it is a positive prediction, and the actual label was also "Spam", so the prediction was true. The false positives are the mails where we have predicted "Spam" (a positive prediction), but the actual label is "NonSpam", so the prediction is false. Correspondingly the false negatives, the mails we should have labeled as "Spam" but didn’t. And the true negatives that we correctly recognized as "NonSpam". This matrix is called a confusion matrix.

Let’s create the confusion matrix for the table with the ten mails that we classified above. Mail 1 is "Spam", but we predicted "NonSpam", so this is a false negative. Mail 2 is "NonSpam" and we predicted "NonSpam", so this is a true negative. And so on. We end up with this table:

Actual label
Spam NonSpam
Predicted label Spam 1 3
NonSpam 2 4

In the next post we will take a loo at how we can calculate performance measures from this table.

Link for a second explanation: Explanation from an Information Retrieval perspective

Typesetting text in math mode (2)

In a previous post (Typesetting text in math mode) I advertised the use of \mbox to write text in mathematical formulas. This works when you are in the "standard size", but looks funny if you have subscripts because the sizes are off:

$ 50 \mbox{ apples}_{\mbox{yellow}} \times 
100 \mbox{ apples}_{\mbox{red-green}} 
= \mbox{lots of apples}^{\mbox{to eat}} $

looks like
50 \mbox{ apples}_{\mbox{yellow}} \times 100 \mbox{ apples}_{\mbox{red-green}} = \mbox{lots of apples}^{\mbox{to eat}}

In these cases (and also in the standard cases but there it looks the same), you can use the command \text which will come out in the right font size. In addition to just \text, there is also \textbf (bold face), \textit (italics) and \texttt (typewriter).

$ 50 \text{ apples}_{\text{yellow}} \times 
100 \textit{ apples}_{\texttt{red-green}} 
= \textbf{lots of apples}^\text{to eat} $

looks like
50 \text{ apples}_{\text{yellow}} \times 100 \textit{ apples}_{\texttt{red-green}} = \textbf{lots of apples}^\text{to eat}

Note: Most of the time \text should just work in math mode without any packages, but for some distributions you need to explicitly load the package amstext or amsmath.

Euclidean and cosine distance for unit vectors (and negative entries!)

Just a few quick words about the assumption we made in the last post about all our entries in the vectors being positive so that we can define the cosine distance as 1 minus the similarity. This assumption is actually not necessary. We can have negative entries, as long as our vectors are normalized to unit length everything still works.

Remember Euclidean distance for unit vectors:
d_{\text{euclid}}(\vec{p},\vec{q}) = \sqrt{2(1 - \sum_i p_i q_i)}

And cosine similarity for two unit vectors:
s_{\text{cosine}}(\vec{p},\vec{q}) = \sum_i p_i q_i

So now, like we did in the last post, let’s say we have two vectors v and w and we know that measured with Euclidean distance, v is closer to some other point p than w*:
d_{\text{euclid}}(\vec{p},\vec{v}) \leq d_{\text{euclid}}(\vec{p},\vec{w})

We do the same steps as in the last post, but then go on and get rid of the 1 and the minus (attention, this changes the direction of the inequality):
1 - \sum_i p_i v_i \leq 1 - \sum_i p_i w_i
\Leftrightarrow  - \sum_i p_i v_i \leq - \sum_i p_i w_i
\Leftrightarrow  \sum_i p_i v_i \geq \sum_i p_i w_i

Voila, cosine similarity!

So if p is closer to v than to w as measured with Euclidean distance, the cosine similarity of p and v is higher than that of p and w:
d_{\text{euclid}}(\vec{p},\vec{v}) \leq d_{\text{euclid}}(\vec{p},\vec{w})  \Leftrightarrow  s_{\text{cosine}}(\vec{p},\vec{v}) \geq s_{\text{cosine}}(\vec{p},\vec{w})

So whenever you have unit length vectors and are only interested in relative distances, it shouldn’t make a distance whether you use Euclidean distance or cosine similarity.

* Same footnote as last time: The text says “closer” and not “closer or the same” and that is actually what I wanted to say, but there seems to be some strange bug in this LaTeX plugin that doesn’t allow you to use the < sign in a formula... so we'll take the less-or-equal sign and just ignore the equal-part.

Euclidean and cosine distance for unit vectors

The Euclidean distance between two vectors p and q is the length of the line segment that connects them (here and in all following formulas the sum is over all dimensions of the vectors, i.e., if we have n dimensions the sum ranges from i=0 to n):
d_{\text{euclid}}(\vec{p},\vec{q}) = |\vec{p} - \vec{q}| = \sqrt{\sum_i (p_i - q_i)^2}

Using the binomial expansion, we can write this as follows:
d_{\text{euclid}}(\vec{p},\vec{q}) = \sqrt{\sum_i p_i^2 - 2\sum_i p_i q_i +\sum_i q_i^2}

Unit vectors have a length of 1 (by definition), length is calculated as the Euclidean norm, that is, the Euclidean distance of a vector to the zero vector, i.e., the square root of the sum of all sqared entries in the vector:
|\vec{p}| = d_{\text{euclid}}(\vec{p},0) = \sqrt{\sum_i (p_i-0)^2 } = \sqrt{\sum_i p_i^2 }

If something is 1, its square is also 1:
\sqrt{\sum_i p_i^2 } = 1  \Leftrightarrow \sum_i p_i^2 = 1

We can now replace the squared sums over all vector elements in the formula for Euclidean distance with 1:
d_{\text{euclid}}(\vec{p},\vec{q}) = \sqrt{1 - 2\sum_i p_i q_i + 1} = \sqrt{2 - 2\sum_i p_i q_i} = \sqrt{2(1 - \sum_i p_i q_i)}

Now let’s see how the cosine distance is defined. The more common thing to do is to calculate the cosine similarity of two vectors as the cosine of the angle between them:
s_{\text{cosine}}(\vec{p},\vec{q}) = \frac{\vec{p} \cdot \vec{q}}{|\vec{p}| |\vec{q}|} = \frac{\sum_i p_i q_i}{|\vec{p}| |\vec{q}|}

As we have unit vectors, we can get rid of the division by the length (which is always 1), so the formula is simplified to the dot product between the two vectors:
s_{\text{cosine}}(\vec{p},\vec{q}) = \sum_i p_i q_i

When we have a vector space where the entries correspond to occurrences of terms in a document, all entries are positive, so the value of the cosine similarity will always be between zero and one. This means, we can define the cosine distance as:
d_{\text{cosine}}(\vec{p},\vec{q}) = 1 - s_{\text{cosine}}(\vec{p},\vec{q}) = 1 - \sum_i p_i q_i

So let’s put it together. Let’s say we have two vectors v and w and we know that measured with Euclidean distance, v is closer to some other point p than w is*:
d_{\text{euclid}}(\vec{p},\vec{v}) \leq d_{\text{euclid}}(\vec{p},\vec{w})

We can now replace the Euclidean distance with the formula from above, square both sides (because that doesn’t change the inequality relation) and get rid of the two that appears on both sides:
\sqrt{2(1 - \sum_i p_i v_i)} \leq \sqrt{2(1 - \sum_i p_i w_i)}
\Leftrightarrow  2(1 - \sum_i p_i v_i) \leq 2(1 - \sum_i p_i w_i)
\Leftrightarrow  1 - \sum_i p_i v_i \leq 1 - \sum_i p_i w_i

What we are left with is the cosine distance! So, putting start and end together, what we have shown is:
d_{\text{euclid}}(\vec{p},\vec{v}) \leq d_{\text{euclid}}(\vec{p},\vec{w})  \Leftrightarrow  d_{\text{cosine}}(\vec{p},\vec{v}) \leq d_{\text{cosine}}(\vec{p},\vec{w})

This doesn’t mean that when you calculate Euclidean distance and cosine distance between two vectors that you will get the same number. But whenever you are only interested in relative distances (that means you only want to know which of two vectors is closer to something than the other) and you have vectors that are normalized to unit length with only positive entries, then the result should be the same whether you use cosine or Euclidean distance.

* The text says “closer” and not “closer or the same” and that is actually what I wanted to say, but there seems to be some strange bug in this LaTeX plugin that doesn’t allow you to use the < sign in a formula... so we'll take the less-or-equal sign and just ignore the equal-part.

Precision-Recall-Curves and Mean Average Precision

Precision-recall curves are often used to evaluate ranked results of an information retrieval system (e.g., a search engine). The principle is easy, for every search result, check the precision and recall you have until now (precision/recall at k). If you plot this in a graph with recall on the x-axis and precision on the y-axis, you end up with something like this (blue line):

The essential shape is always the same. Why? Let’s say we have looked at k results which corresponds to a point with a precision and a recall value. What can happen when we go to result k+1? The result can be correct, then recall will increase and precision as well – the curve goes up and right. Or it can go wrong, then recall stays the same and precision drops – the curve goes straight down.

The red line is the interpolated precision, meaning we define precision at some arbitrary level to be the maximum precision reached at any later recall level. Essentially, we flatten the "teeth" of the curve. The difference can be pretty big (see in the plot at recall around 0.2), we can even "skip" a tooth.

What would the curve look like for a perfect system? Meaning a system that only returns correct results? It would be 1.0 for every recall level. A system that never returns a correct result? 0 for every recall level.

What should the value be for precision at recall 0? If we interpolate, the answer is clear: the highest precision value at some later recall level. This does not have to be 1.0 – it could happen that the first result is wrong, the second correct, then we have P=0.5 at k=2 and it might only drop from there.


Sancho McCann. It’s a bird… it’s a plane… it depends on your classifier threshold. 2011.
Christopher D. Manning, Prabhakar Raghavan and Hinrich Schütze. Introduction to Information Retrieval. Cambridge University Press, 2008. (Chapter 8)

Undefined references – LaTeX Warning

Sometimes LaTeX tells you this:

LaTeX Warning: There were undefined references.

If you get this warning, you will notice some ?? in your document at places where references should be. For references to sections, tables of figures, just run pdflatex again (and check for typos). For bibliography references you need to run bibtex.

Let’s assume you are writing a LaTeX file with the name ‘report.tex’. Do the following:

> pdflatex report.tex
[...]
LaTeX Warning: Citation `Liu2010' on page 1 undefined on input line 39.
[...]
LaTeX Warning: Reference `fig:results' on page 1 undefined on input line 65.
[...]
LaTeX Warning: There were undefined references.
[...]
LaTeX Warning: Label(s) may have changed. Rerun to get cross-references right.
[...]
> bibtex report
[...]
> pdflatex report.tex
[...]
LaTeX Warning: Label(s) may have changed. Rerun to get cross-references right.
[...]
> pdflatex report.tex
[...]

You need to run pdflatex again twice after calling bibtex. Twice, because layout may change and things end up somewhere else after you inserted the references.

The most important commands for SVN

Here are the most important commands for using SVN in the command line on Linux. You have to be inside your local folder where you put the svn else it won’t work (most common source for error “Skipping .'” or “. is not a working copy”).

update

To update your local working copy to the newest version that exists on the server (ALWAYS do this before you start to change things or your teammates will kill you!!):

svn update

add

Files you move into the local working copy folder are not added automatically. If you want the file to be part of the SVN, you have to add it. It works for multiple files or folders, too.

svn add 

delete

To delete files from the repository, first mark them for deletion:

svn rm 

On the next commit, the file will be deleted from the repository and from your local copy! If you want to keep the local copy, do

svn rm --keep-local 

revert

With revert, you can undo pending changes in your working copy (e.g. add, delete) before the next commit.

svn revert 

Also handy in case you forgot what local changes you made and you want to return to the latest “safe” version from the repository.
Note that this does NOT enable you to go back to a previous already-commited version. To do that, you can checkout the specific version of your repository at some other place (with the option -r) and manually get what you need or follow the procedure outlined here.

commit (changes to the repository)

If you have changed a file, added or deleted something and want to put the changes into the SVN you have to commit it, without that the changes are only in your working copy and not on the server!

svn ci -m ""

log

It is good practice to write log messages with commits. You can review these log messages with

svn log

You should do an update of your working copy before this command, otherwise you will not get all messages. In case this is a lot of messages, you can add a limit, e.g., display only the latest 5 log entries:

svn log -l 5

status

To see which files of your working copy haven’t been committed yet:

svn status

Common SVN status codes:

diff

To see what has changed in a file from the last version to the current version:

svn diff 

More resources: You can always use “svn help” to see what else is there or take a look at the excellent book.

A typical SVN session

We assume you have created a working copy and there is already some content in your SVN that you share with others. All of this assumes that you are using some linux shell and are in the folder of your working copy. If you are in the wrong folder else it won’t work (most common source for error “Skipping .'” or “. is not a working copy”).

First thing you do is update (i.e. get the latest changes from the server), in case your teammates changed something. You don’t want to work on an old version!

svn update

Then you open some files, change some things (in "main.adb"), add a new file ("list.adb") and delete a different file ("array.adb"). After two hours work you need a coffee and it’s always a good idea to commit (i.e. send your changes to the server) before taking a longer break. Before you commit, you want to know what changed:

svn status

The message you get will look more or less like this:

M    main.adb
?    list.adb
!    array.adb

This means, you have modified "main.adb", there is a file "list.adb" that SVN doesn’t really know about and "array.adb" should be there, but SVN cannot find it.

If you just commit, only "main.adb" will get changed and on the next update "array.adb" will be restored in your working copy. Why? Because you need to tell SVN explicitly that you want a file to be added or deleted. So let’s do that.

svn add list.adb
svn del array.adb

Now let’s check the status again, the result will be:

M    main.adb
A    list.adb
D    array.adb

We are satisfied and commit the whole thing:

svn ci -m "Replaced array with list, added list.adb, deleted array.adb"

It is always a very good idea to write a meaningful commit message (the parameter -m), so that your teammates know what has been changed. It also makes it easier to go back to a specific version, e.g. the version just before you removed the array.